AI Summary
- Shows your crypto holdings at the end of the financial year
- Includes all assets across connected exchanges and wallets
- Displays quantity, acquisition cost, and year-end valuation for each asset
- Useful for CAs preparing financial statements and for your own year-end portfolio review
- The closing balance of one year becomes the opening balance of the next
- Available to all users regardless of country setting
What Does This Report Show?
| Column | What It Shows |
|---|---|
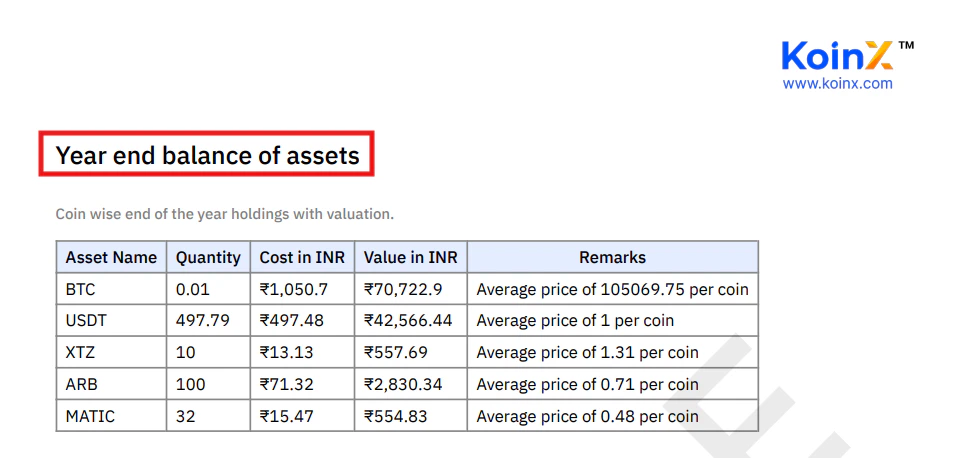
| Asset Name | Name of the cryptocurrency |
| Quantity | Amount held at the end of the financial year |
| Cost | Total acquisition cost of the asset |
| Value | Valuation of the holdings at year end |
| Remarks | Additional details such as average acquisition price per coin |
| Asset | Quantity | Cost | Value | Remarks |
|---|---|---|---|---|
| BTC | 0.01 | Rs. 1,050.70 | Rs. 70,722.90 | Average price per coin |
| USDT | 497.79 | Rs. 497.48 | Rs. 42,566.44 | Average price of Rs. 1 per coin |
How Is This Different from My Live Portfolio?
| View | Shows | When |
|---|---|---|
| Portfolio Dashboard | Current holdings | Right now |
| End of Year Balance Report | Historical holdings snapshot | Last day of selected financial year |
How Does KoinX Calculate This?
- Processes all transactions up to the end of the financial year
- Calculates the remaining quantity of each asset
- Determines the total acquisition cost
- Calculates the valuation of those holdings
Understanding the Cost and Value Columns
Cost is the total cost incurred to acquire the assets you currently hold, calculated from your transaction history. Value is the valuation of those holdings based on market prices at year end. Remarks shows the average price per coin used to calculate acquisition cost, which is useful for reconciliation.Why Might My Balance Differ from My Exchange?
Small differences are normal. Larger quantity differences indicate missing transactions. Multiple sources: KoinX combines data from all connected exchanges and wallets, while each exchange only shows its own balance. Missing transactions: If deposits, withdrawals, or trades were not imported correctly, balances may differ from what your exchange shows. Valuation differences: Price sources used for valuation may differ slightly from exchange prices at any given moment.Should End of Year Balance Match Next Year’s Opening Balance?
Yes, in most cases. The closing balance of one financial year becomes the opening balance of the next, provided no historical transactions were changed between generating the two reports. If they do not match, check whether any transactions were edited or added after you generated the End of Year report for that period.Frequently Asked Questions
My CA needs my closing crypto balance. Which report do I share?
My CA needs my closing crypto balance. Which report do I share?
Does this report show both cost and value?
Does this report show both cost and value?
Yes. Cost shows the acquisition cost of your holdings. Value shows the market valuation of those holdings at year end. The difference between the two shows whether you are sitting on unrealised gains or losses at the end of the year.
Should my End of Year balance match next year's Beginning of Year balance?
Should my End of Year balance match next year's Beginning of Year balance?
Yes. The closing balance of one financial year typically becomes the opening balance of the next, as long as no historical transactions were changed in between.
Can I generate this report for previous years?
Can I generate this report for previous years?
Yes. Select a different financial year from the dropdown to generate the year-end balance report for that period.
Why does my year-end balance not match what my exchange shows?
Why does my year-end balance not match what my exchange shows?
KoinX combines data from all connected sources, while your exchange only shows its own balance. Also, if any transactions were not imported correctly, the balances may differ. Large quantity differences usually indicate missing transactions.